
2026 Top Automation Industry Trends for Global Buyers
Automation is no longer confined to large factories with dedicated engineering teams. In 2026, global buyers are comparing robotics, machine vision, connected sensors, and software as parts of one operating system. A packaging line, for example, may combine collaborative robots, barcode readers, and production data dashboards. The promise is faster, steadier work. The practical questions are less glamorous: Will the system fit existing equipment? Can local technicians maintain it? What happens when a component is delayed?
This guide explores the automation industry trends shaping purchasing decisions, from artificial intelligence and flexible robotics to digital twins, predictive maintenance, and workforce training. It also considers what buyers should examine before investing: integration requirements, safety features, supplier support, data quality, and the total cost of ownership. A polished demonstration is useful, but it cannot show every shift, product variation, or maintenance problem. No forecast is perfect. That matters.
For global teams, a promising technology must work beyond a product brochure. Buyers need evidence from relevant applications, clear performance measures, and realistic implementation plans. Regional service capacity and operator involvement can matter as much as headline specifications. Trends may point toward more connected, adaptable systems, but adoption is rarely instant or uniform. Some facilities still depend on older machines, uneven data, or limited technical staff. That is not a failure; it is a condition worth planning for. The sections ahead offer a practical lens for weighing new capabilities against everyday production needs.
Automation in 2026: System Types, Applications, and Buyer Priorities
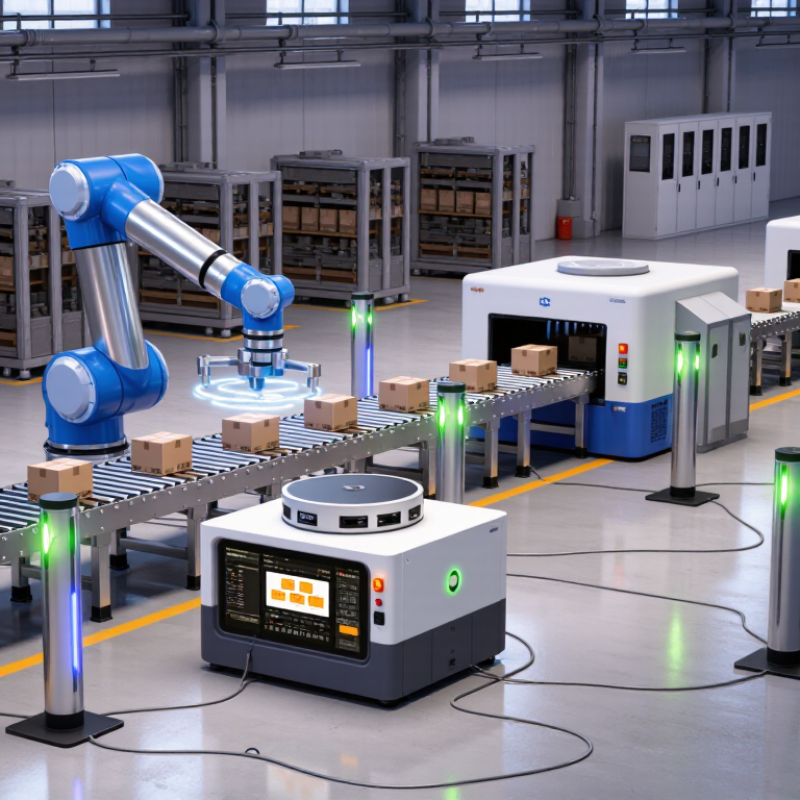
Automation in 2026 will involve matching system types to real production needs, not simply adding more machines. Fixed automation suits stable, high-volume tasks such as packaging or assembly. Programmable equipment handles changing batches, while flexible cells can shift between product variants with less reconfiguration. Collaborative robots, machine vision, and mobile robots may support specific tasks, but they are not universal replacements for existing workflows. Fit matters.
Applications are becoming more connected. A vision system can check labels at the end of a conveyor, while sensors track machine condition and flag unusual vibration. In a warehouse, mobile robots can move totes between picking zones and packing stations. These examples work best when floor layouts, data systems, and staff routines are considered together. A pilot can reveal awkward handoffs that a specification sheet misses. No checklist catches everything.
Global buyers should compare integration effort, service access, training needs, safety provisions, and total operating costs—not just purchase price. Ask how equipment exchanges data with current systems, what happens during a network outage, and how quickly common faults can be diagnosed. Request measurable trial targets, such as cycle time, defect rate, or hours of unplanned downtime. Forecasts are not guarantees, and even a carefully scoped project may need adjustment after real shifts expose missed details.
2026 Top Automation Industry Trends for Global Buyers - Automation in 2026: System Types, Applications, and Buyer Priorities
| Trend | System Types | Typical Applications | Buyer Priorities | Practical Evaluation Measures |
|---|---|---|---|---|
| Flexible industrial robotics | Articulated robots, SCARA robots, delta robots, and collaborative robots | Machine tending, assembly, pick-and-place, packaging, and palletizing | Match payload, reach, cycle time, end-of-arm tooling, and safety requirements to the task. Assess changeover needs and integration with existing equipment. | Payload and reach at the required position; cycle time under production conditions; changeover time; cell footprint; risk assessment and safeguarding plan. |
| Autonomous movement of materials | Autonomous mobile robots (AMRs), automated guided vehicles (AGVs), and fleet-management software | Transport between storage, production, kitting, and shipping areas | Check route conditions, traffic management, load type, lift or conveyor interfaces, charging arrangements, and how the fleet will connect with warehouse or production systems. | Payload; route throughput; operating hours between charging; docking accuracy; performance in representative traffic and aisle conditions; recovery process for blocked routes. |
| Machine vision and in-line inspection | 2D and 3D vision systems, cameras, lighting, and image-processing software | Presence checks, measurement, orientation, surface inspection, and robot guidance | Validate performance using representative products, defect samples, lighting, line speeds, and environmental conditions. Plan for product variation and recipe management. | Detection and false-reject rates on agreed test samples; inspection time; measurement repeatability; performance across product variants and operating shifts. |
| Connected control and production data | PLCs, industrial networks, edge gateways, SCADA, and manufacturing execution systems (MES) | Machine control, line monitoring, traceability, production reporting, and alarms | Prioritize interoperability, clear data ownership, reliable time synchronization, secure remote access, and integration with installed controls and business systems. | Required data availability; interface and protocol compatibility; data latency; traceability completeness; documented access controls and network segmentation. |
| Predictive maintenance and condition monitoring | Vibration, temperature, current, and other condition sensors; analytics software; maintenance systems | Monitoring motors, pumps, gearboxes, bearings, and other critical assets | Start with assets where failure affects safety, quality, or production. Confirm sensor suitability, alert ownership, maintenance workflow, and the evidence behind proposed condition thresholds. | Baseline data quality; useful warning time; alert precision; maintenance actions completed; downtime and maintenance-cost trends against a defined baseline. |
| Digital twins and virtual commissioning | Equipment and process models, simulation tools, and virtual commissioning environments | Layout planning, robot reach checks, line balancing, and control-logic testing | Clarify model scope, required engineering data, update responsibilities, and how simulation results will be checked against the physical installation. | Model coverage of critical processes; assumptions documented; issues found before installation; measured differences between simulated and actual cycle times. |
| Energy-aware automation | Efficient drives and motors, variable-speed control, energy metering, and production-control systems | Compressed-air systems, pumps, fans, conveyors, machine tools, and production scheduling | Compare energy use at equivalent output and operating conditions. Consider idle-state control, peak demand, process quality, and the cost of implementation. | Energy per unit produced; idle and standby consumption; peak demand; production output and quality during the measurement period. |
| Industrial cybersecurity and lifecycle support | Control-system networks, industrial PCs, remote-access tools, and asset-management processes | Protecting production systems, managing updates, and maintaining equipment over its service life | Review asset inventories, access permissions, backup and recovery procedures, patch responsibilities, support duration, and incident-response arrangements. | Documented system inventory; tested backups; role-based access; recovery objectives; software-support period; defined process for security updates. |
| Modular and scalable production cells | Modular machines, standardized interfaces, configurable tooling, and reprogrammable automation | High-mix assembly, packaging, pilot production, and lines with changing product variants | Assess how quickly modules can be added, rearranged, or reconfigured. Confirm interface documentation, tooling availability, and the impact of changes on validation and safety. | Changeover duration; time to add or move a module; integration effort; product-variant coverage; repeatability after reconfiguration. |
| Human-centered automation | Operator interfaces, collaborative workstations, assistive devices, and automated quality prompts | Assembly assistance, inspection, material presentation, and ergonomically demanding tasks | Involve operators in design reviews. Evaluate usability, training needs, task allocation, accessibility, and safe interaction under actual work conditions. | Training time; task completion and error rates; ergonomic assessment; operator feedback; safety review for intended operating modes. |
Buyer guidance: Treat performance figures as application-specific. Confirm requirements through site surveys, representative trials, safety assessments, and a clearly defined baseline before comparing proposals.
Related Posts
-

10 Best Automation Industry Solutions for Global Buyers
-
What Is the Best Automation Industry Supplier in China?
-

What is Robotics and Automation and How It Transforms Industries Today
-

How to Choose Robotic Automation for Your Business
-
7 Tips to Choose Turnkey Automation for Global Buyers?
-
Top Automation Machine Manufacturers for Global Buyers